
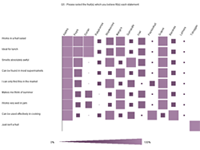
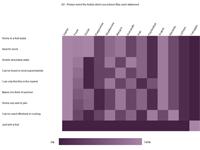
Grid Heatmaps
A graphical display of the volume or percentage selected for any cell in a grid. This can be applied to any data that can be displayed as a grid, and the user can select whether to show the heat map as blocks of colour only, or as size and colour (displayed). Colours are customisable.
| Company | Testimonials | Connects | Contact | ||||||
|---|---|---|---|---|---|---|---|---|---|
| We support the market research process by partnering with you through the data production stage of your project and provide solutions to help you communicate your results better to your clients. | "Data Squirrels worked creatively and with great speed to ensure that I got my coded tables back with plenty of time for analysis. They are highly experienced and provide service above and beyond the specifications provided." - Project Manager at Research Agency |
|
Data Squirrels 1652 Wollombi Rd Millfield NSW 2325 p (02) 8003 7675 |


